

Introduction
Read and Understood Excel reports provide a detailed export of the document acknowledgment process. The data exported, using PivotTables, can be used view data by:
Employee or Document Version
Groups / Departments
This article provides details on how to access the reports and examples of using PivotTables to view the data with percentage calculations, for example.
The three Excel reports:
Active Document Versions for All Employees - Provides a list of every document that is in the Acknowledgment Lifecycle so you can view the current status of those documents and number of acknowledgements captured.
Document Versions for All Employees - Lists all employees and document versions that have or have not been acknowledged. Example Spreadsheet.
Groups (as Departments) - Where customers are using Azure Active Directory (AAD) groups, it is possible to report on those groups and the members of those groups that have or have not acknowledged. Example Spreadsheet.
How to Access the Reports
The Reports are accessible via the Read and Understood App website.
- Open the Read and Understood App from within the site it's installed
- Click 'Site Administration' from the Navigation Menu
- Locate the Section 'Site wide Compliance reports':
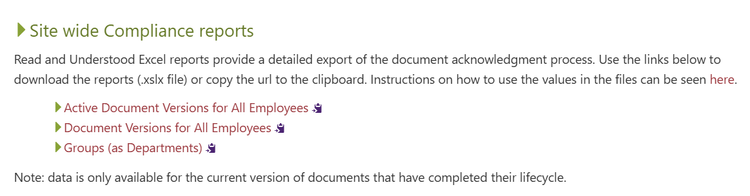
‘Active Documents…’ and ‘Document Versions…‘
The presentation of both reports is almost identical, with the ‘Active Documents…’ containing an additional column ‘Due On’ to show when that document will complete it’s acknowledgement cycle.
The report is provided as an Excel spreadsheet so you can use PivotTables to process the data as you wish (examples below). The information available in the report includes:
Document Name inc. SharePoint Version
AAD groups they are a member of (known to the App)
Employee acknowledged or not.
Employee’s manager (if property is set in Azure AD)

Sample data from an Employee report
Group / Dept. Compliance
Customers who use AAD groups to send Read and Understood Acknowledgement requests can benefit from our Site Comliance Report. This report will show, by Group/Dept., the percentage of acknowledgements of having read that document version.

Example compliance data spreadsheet.
Department / Employee - Pivot Table Examples
% Acknowledged by Document
- Open the spreadsheet in Excel.
- Select cell A1 and click Home > Format Table (select any of the available templates)

- Click Insert > Pivot Table - accept the defaults and click Ok

- In the PivotTable Fields - Drag Documents into the Rows Field (Ensure the Field List option in the navigation is enabled)

From the Pivot Table Analysis click 'Fields, Items & Sets' > 'Calculated Field...'

- In the Name Field type % Acknowledged
- To add Fields to the Formula select Acknowedged and click add. You should have = Acknowledge
- Next add /
- Next select Count and click Add. You should now have = Acknowledge / Count (like this...)

- Click Ok
- The new Field will be added to the Values field of the PivotTable Fields. Click the field and select Field Settings

- In the Pivot Table Field click the Number Format button and set the Category to Percentage.


- Click Ok to Close the dialog and Click Ok again to close the Field Settings Dialog
Example PivotTable showing Document Acknowledge %

Sample of documents acknowledge and percentage of Employee acknowledgement
% Acknowledged by Employee
- Open the spreadsheet in Excel.
- Select cell A1 and click Home > Format Table (select any of the available templates)
- Click Insert > Pivot Table - accept the defaults and click Ok
- In the PivotTable Fields - Drag Employee into the Rows Field (Ensure the Field List option in the navigation is enabled)

From the Pivot Table Analysis click 'Fields, Items & Sets' > 'Calculated Field...'
- In the Name Field type % Acknowledged
- To add Fields to the Formula select Acknowedged and click add. You should have = Acknowledge
- Next add /
- Next select Count and click Add. You should now have = Acknowledge / Count (like this...)
- Click Ok
- The new Field will be added to the Values field of the PivotTable Fields. Click the field and select Field Settings
- In the Pivot Table Field click the Number Format button and set the Category to Percentage.
- Click Ok to Close the dialog and Click Ok again to close the Field Settings Dialog
Example PivotTable showing Employee Acknowledge %

Sample of Employee acknowledgements and percentage of Document acknowledgement

